Tracing Linux Kernel Code without a Debug Connection
This tutorial shows how to trace the Linux Kernel code (i.e. record variable values at arbitrary code locations) without having to setup regular debugging connection. This allows tracing targets that would otherwise be hard to debug (e.g. embedded devices without JTAG, desktops/laptops incompatible with KGDBoE, etc).
In this tutorial we will create a kernel module implementing a RAM disk, will run it on a non-debuggable VM, and will show how to use tracing to see what sectors are being read and written. Before you begin, install VisualKernel 4.1 or later.
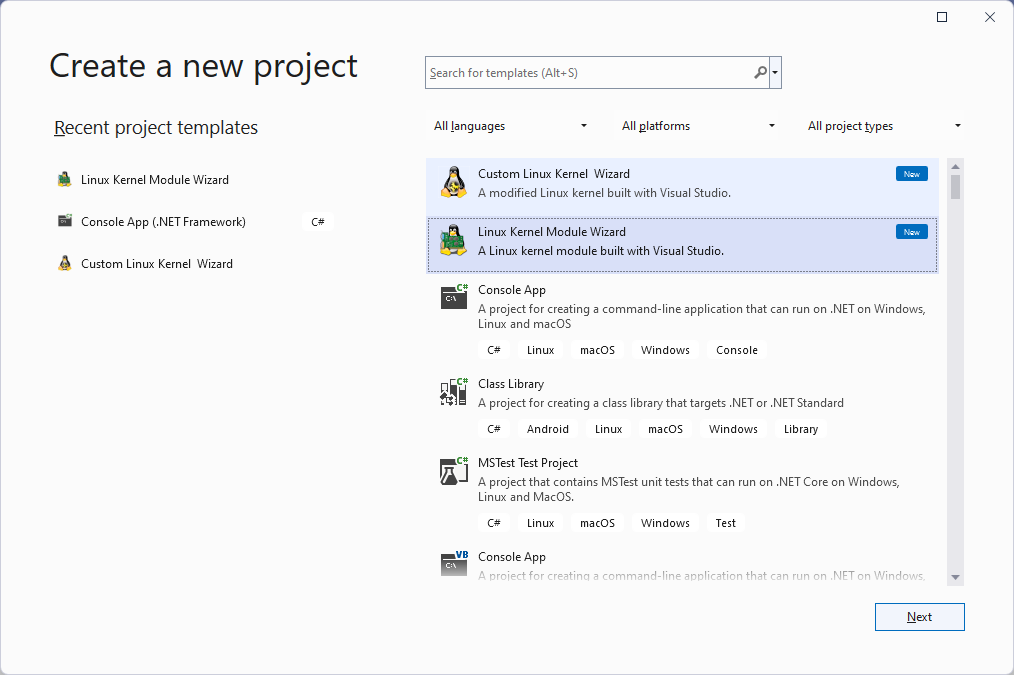
- Start Visual Studio and open the VisualKernel Linux Kernel Module wizard:
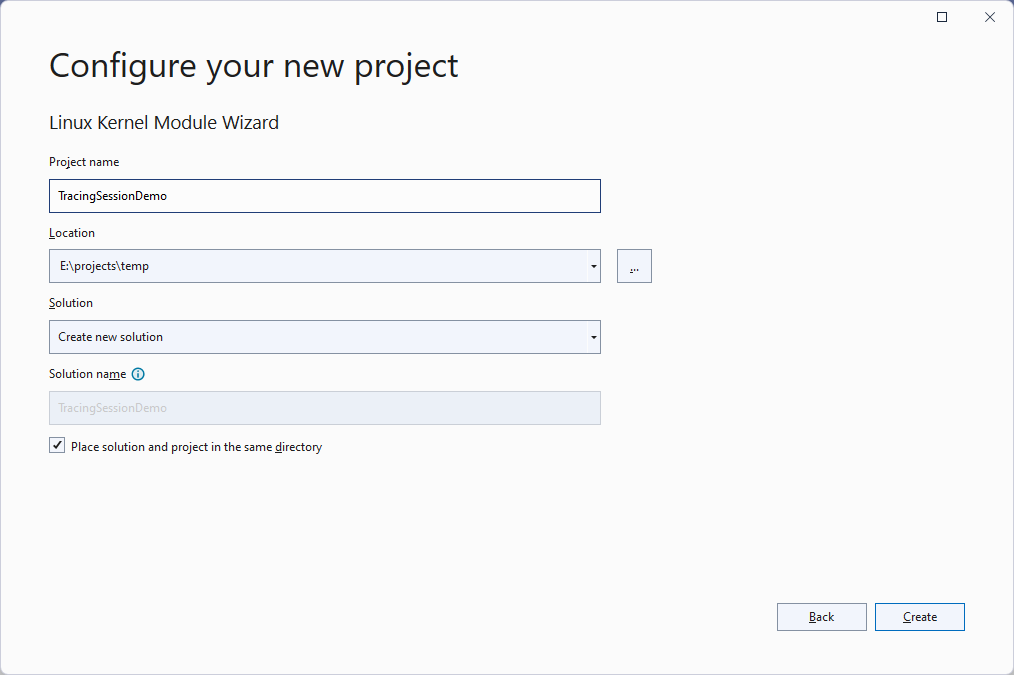
- Enter the name and location for your project:
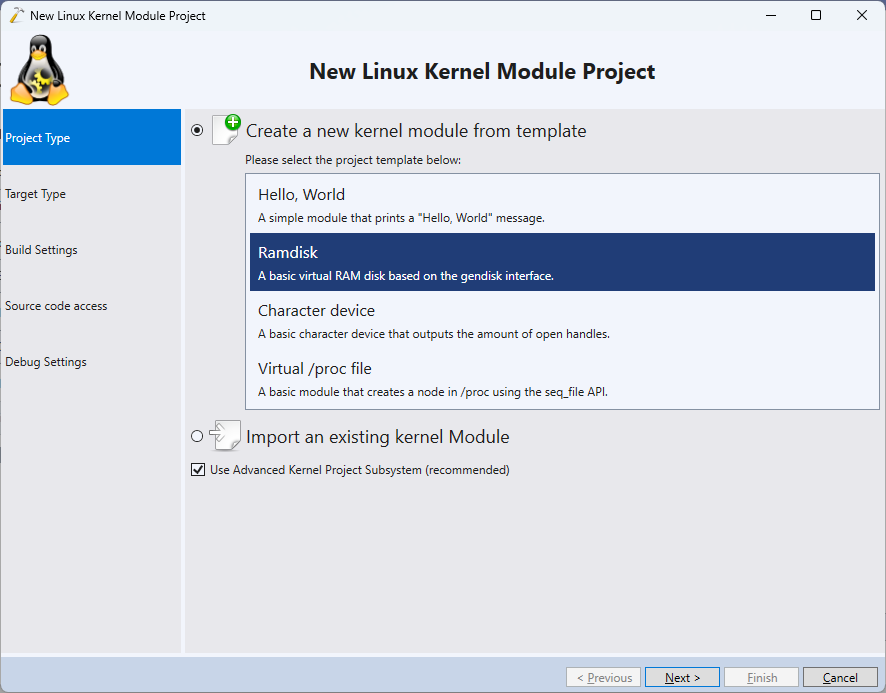
- Select the “Ramdisk” module template and click “Next”:
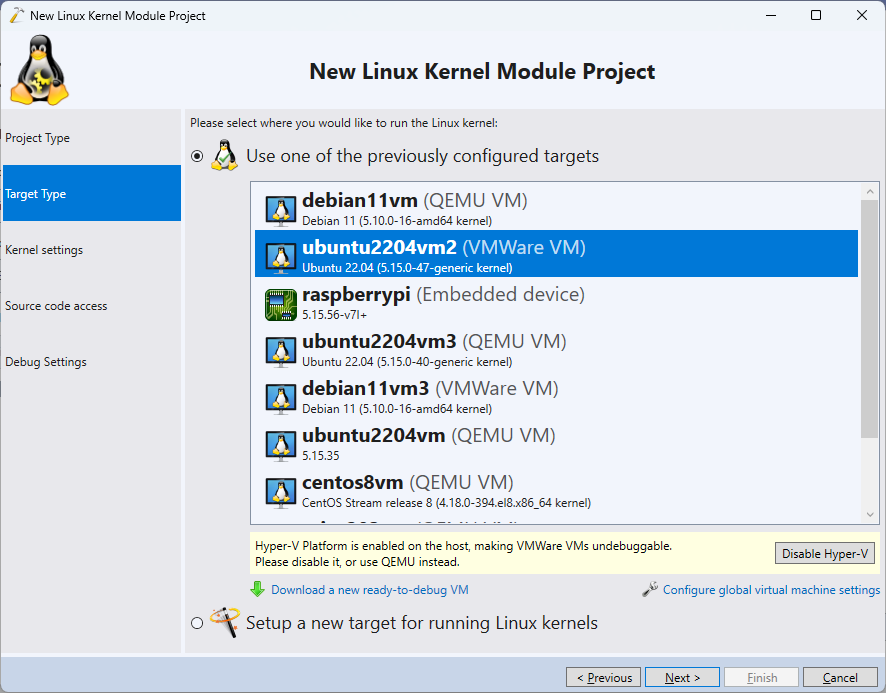
- Select the target where you would like to run the module. In this tutorial we will use a VMWare virtual machine that is itself running under Hyper-V, making it not debuggable using the regular means:
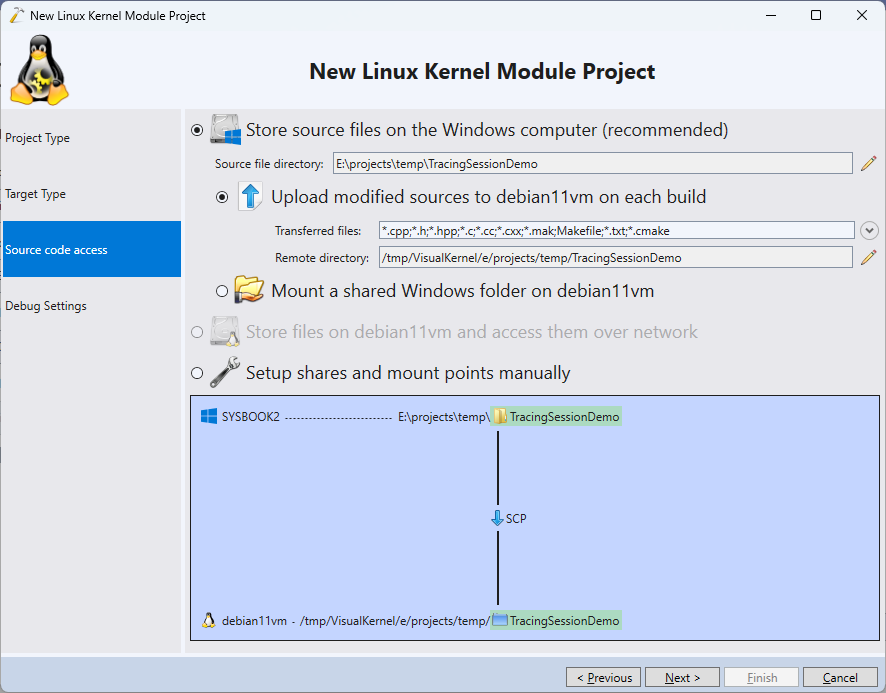
- Proceed with the default source code access settings:
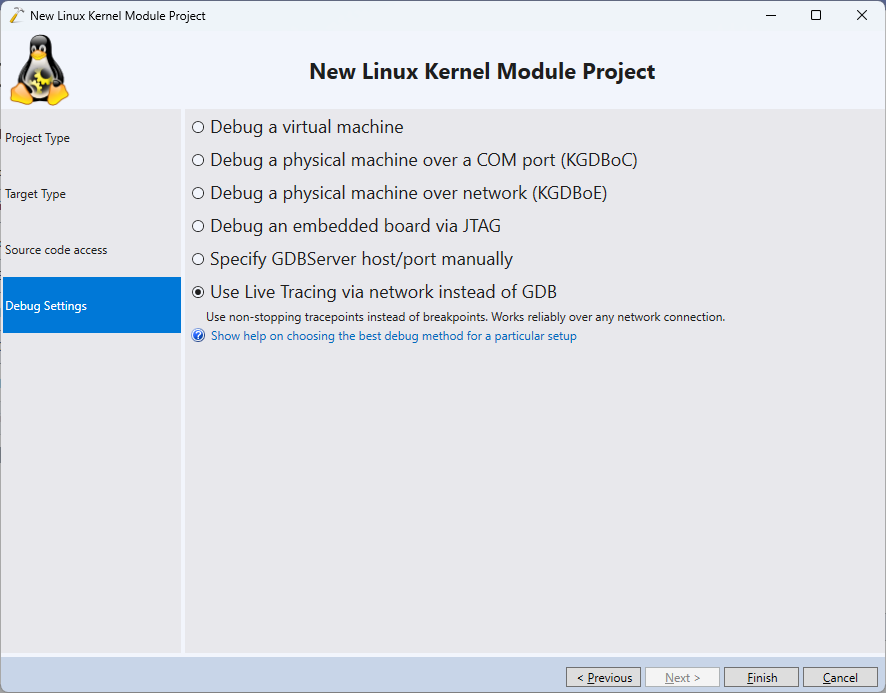
- The Debug Settings page of the wizard normally allows selecting a debug method (e.g. JTAG). However, starting from VisualKernel 4.1, you can also choose “Use Live Tracing” to completely bypass it and use a regular network connection instead:
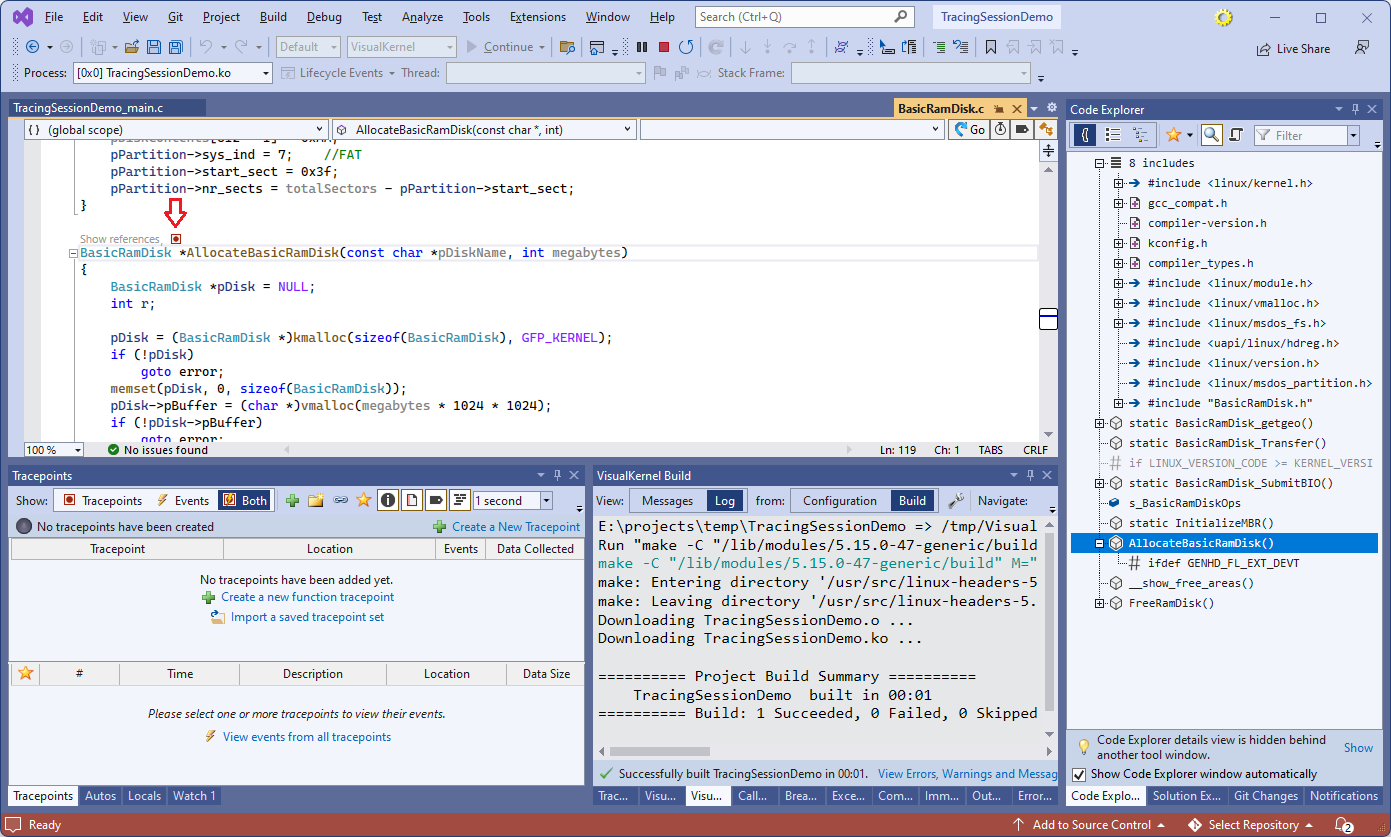
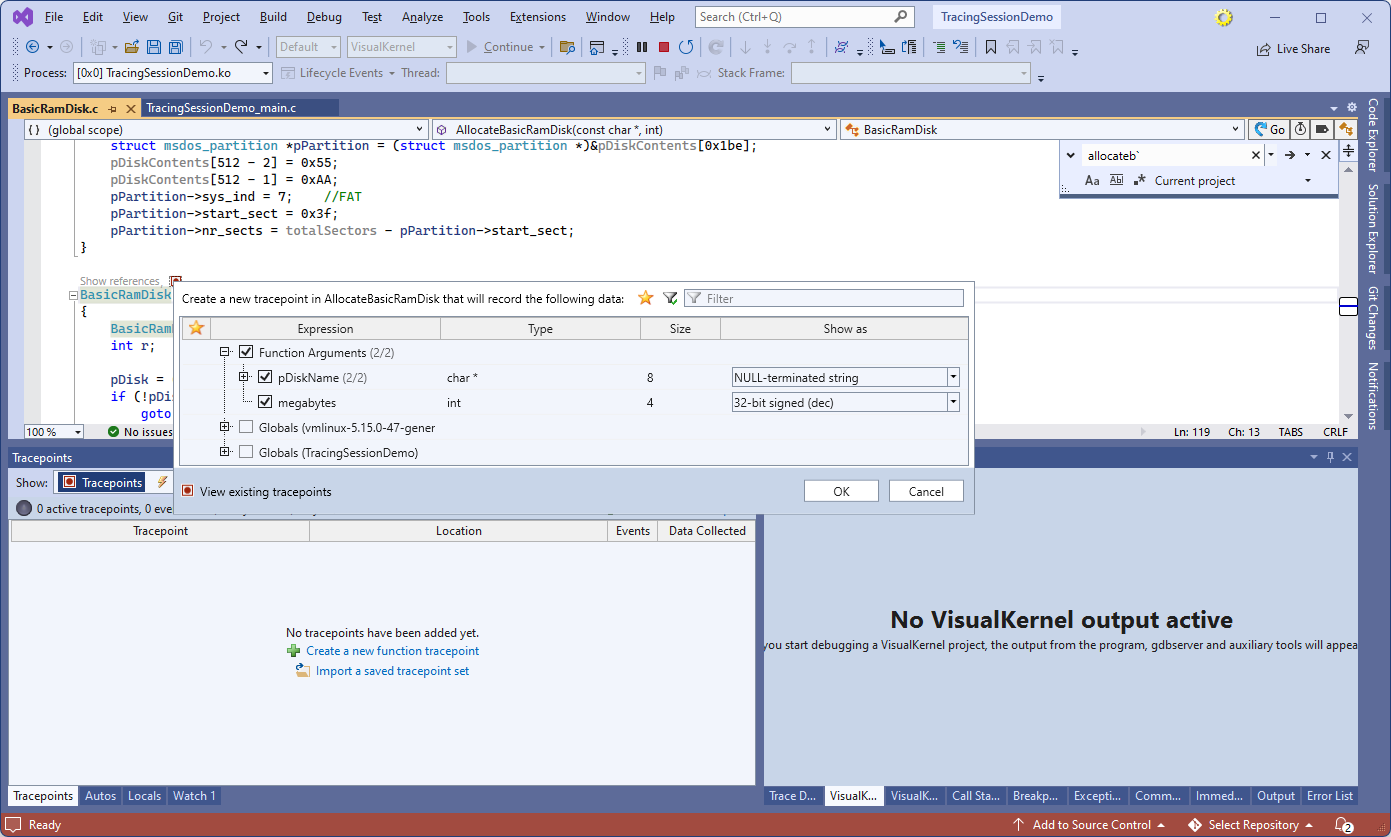
- Press “Finish” to create the project, then build the entire solution. Once it is built, press F5 to start a tracing session. When it launches, click on the tracepoint icon near the AllocateBasicRamDisk() function:
- Check both function arguments, set pDiskName type to NULL-terminated string, and click “OK” to create a tracepoint:
 You can also use the Debug->Windows->Tracepoints command to trace any function in your module (or the kernel itself) by name.
 - Use the green bulb icon on top of the Tracepoints window to reload the module. VisualKernel will show that the AllocateBasicRamDisk() function got called, and will display the values of the arguments:
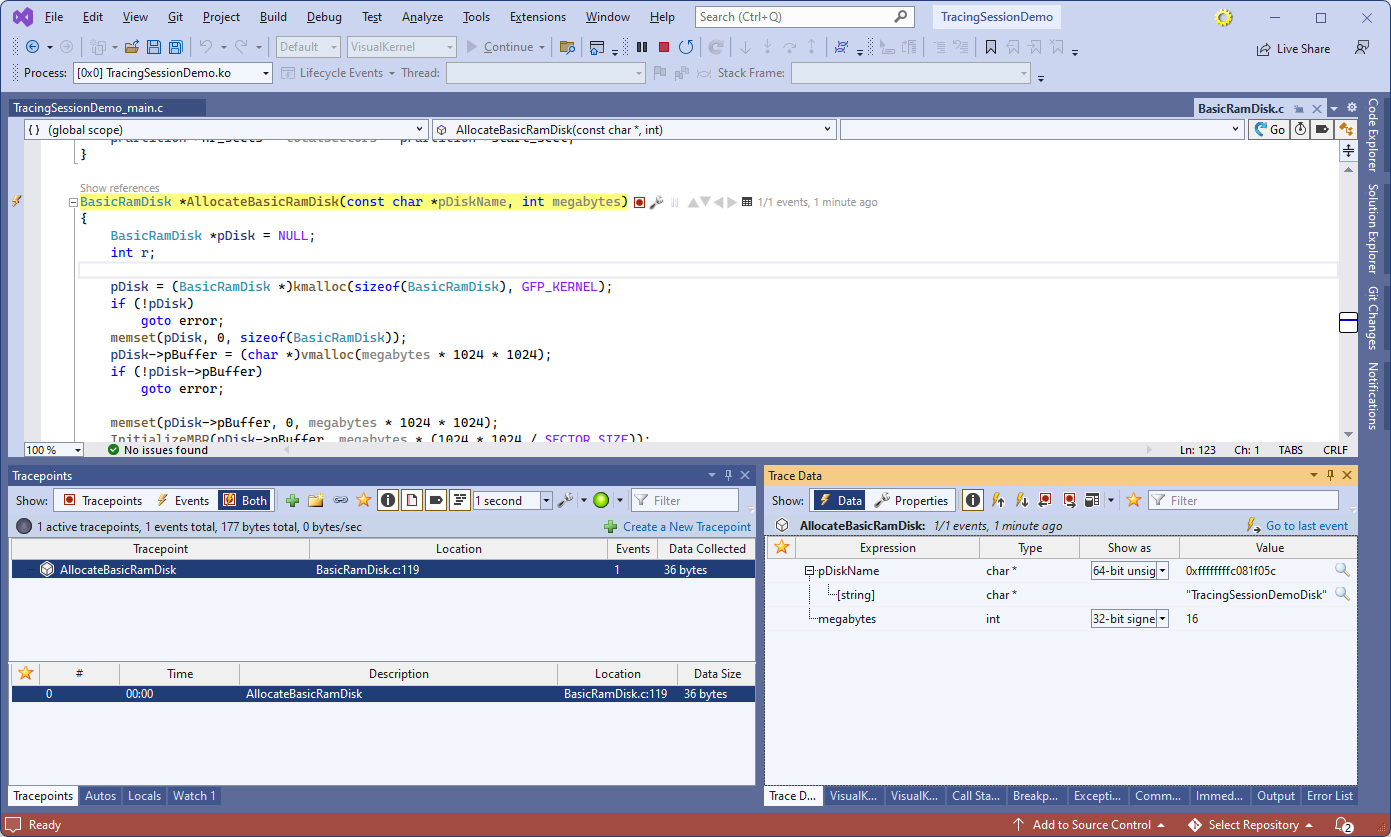 Note that unlike breakpoints, that stop the target, tracepoints immediately capture the selected data in an internal memory buffer, and resume it. Hence, tracepoints do not interfere with the regular kernel operation, and do not require any special debugging setup other than a regulra network connection.
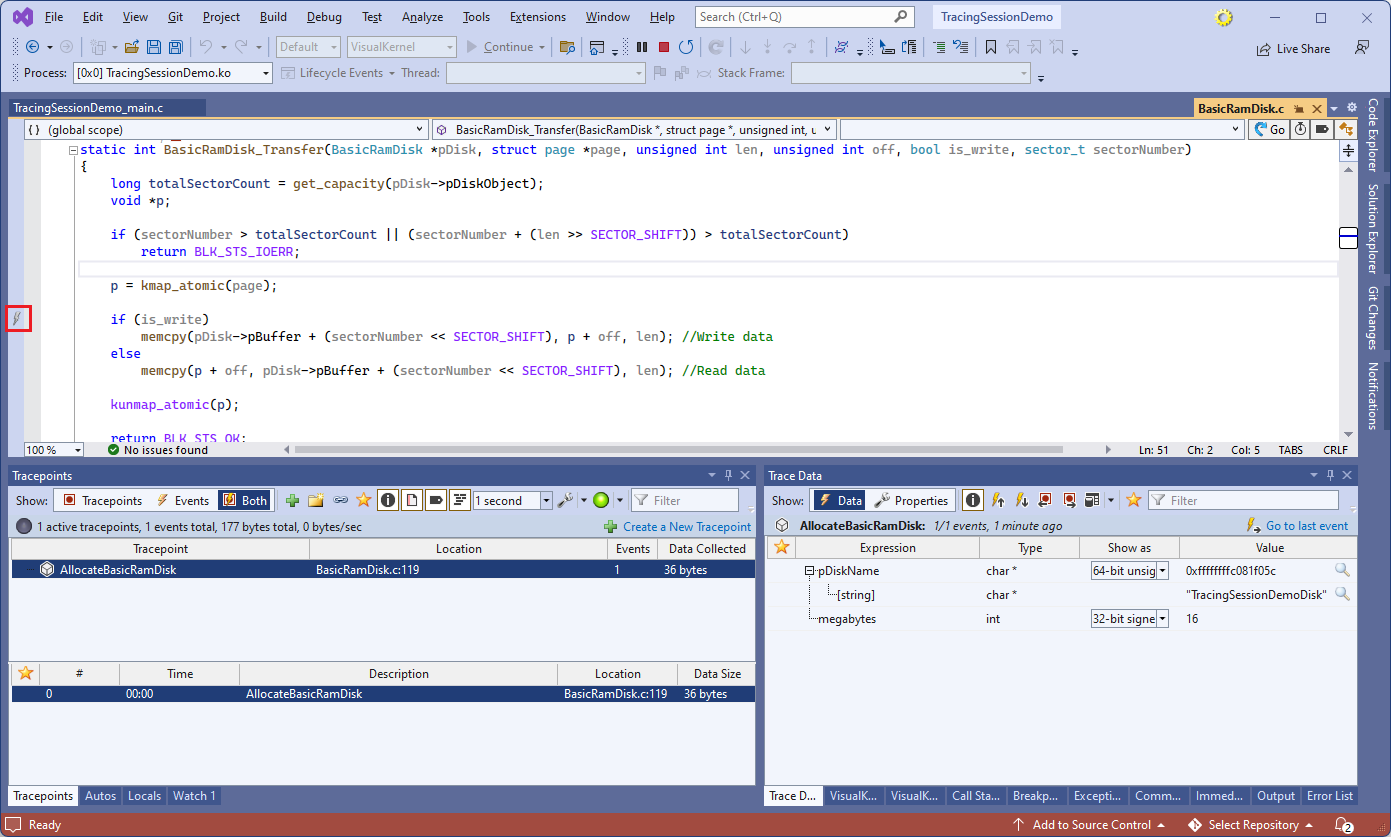
 - Now we will set another tracepoint using the tracepoint bar. Hover the mouse to the left of the is_write check in BasicRamDisk_Transfer() until you see the gray lightning icon. Click on it to begin creating a tracepoint:
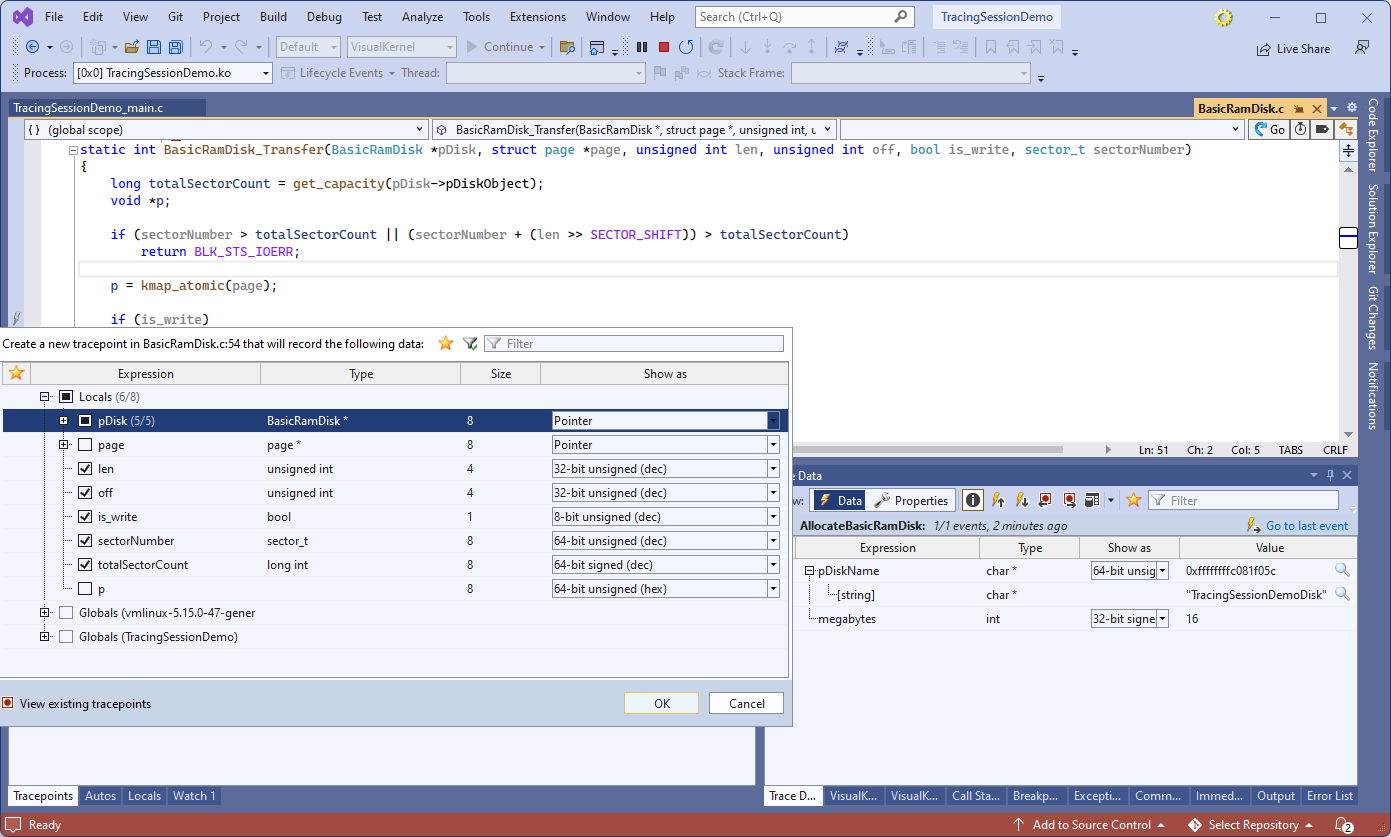
- Select the data you would like to trace and press OK:
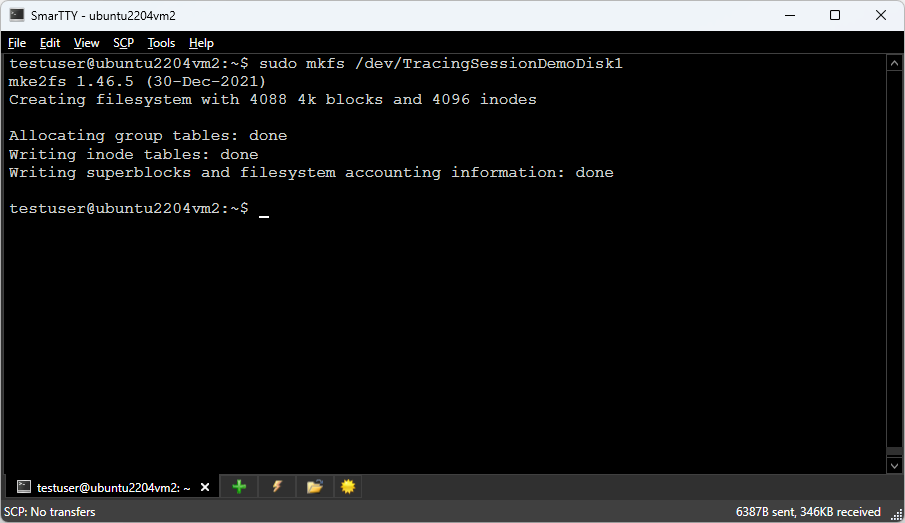
- On the target, run the “mkfs” command to initialize the RAM disk we created:
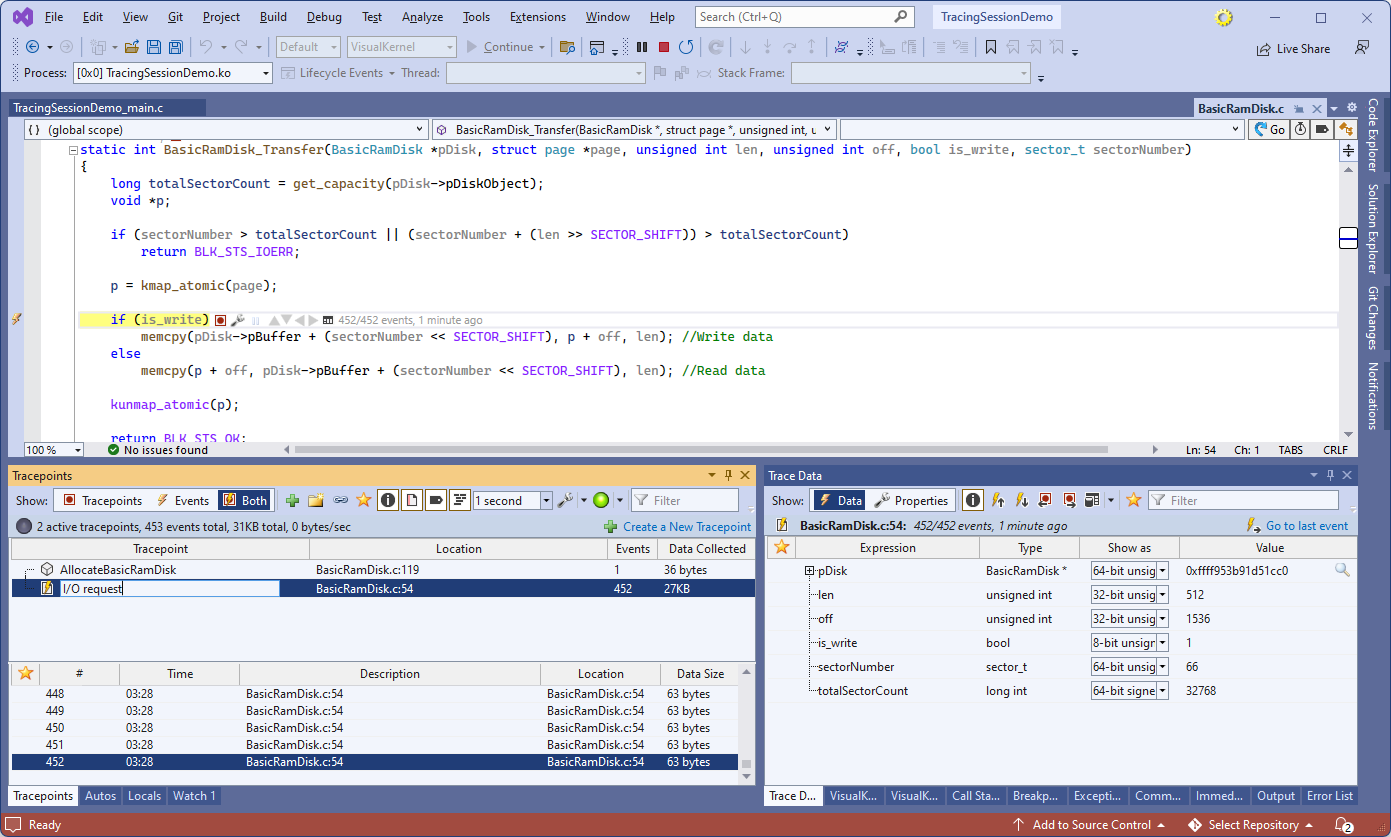
- The tracepoint we created will immediately report multiple events. You can click through them to see the captured data in each case. You can flag individual events as favorite, rename them to provide meaningful descriptions, or rename the individual tracepoints to more meaningful names:
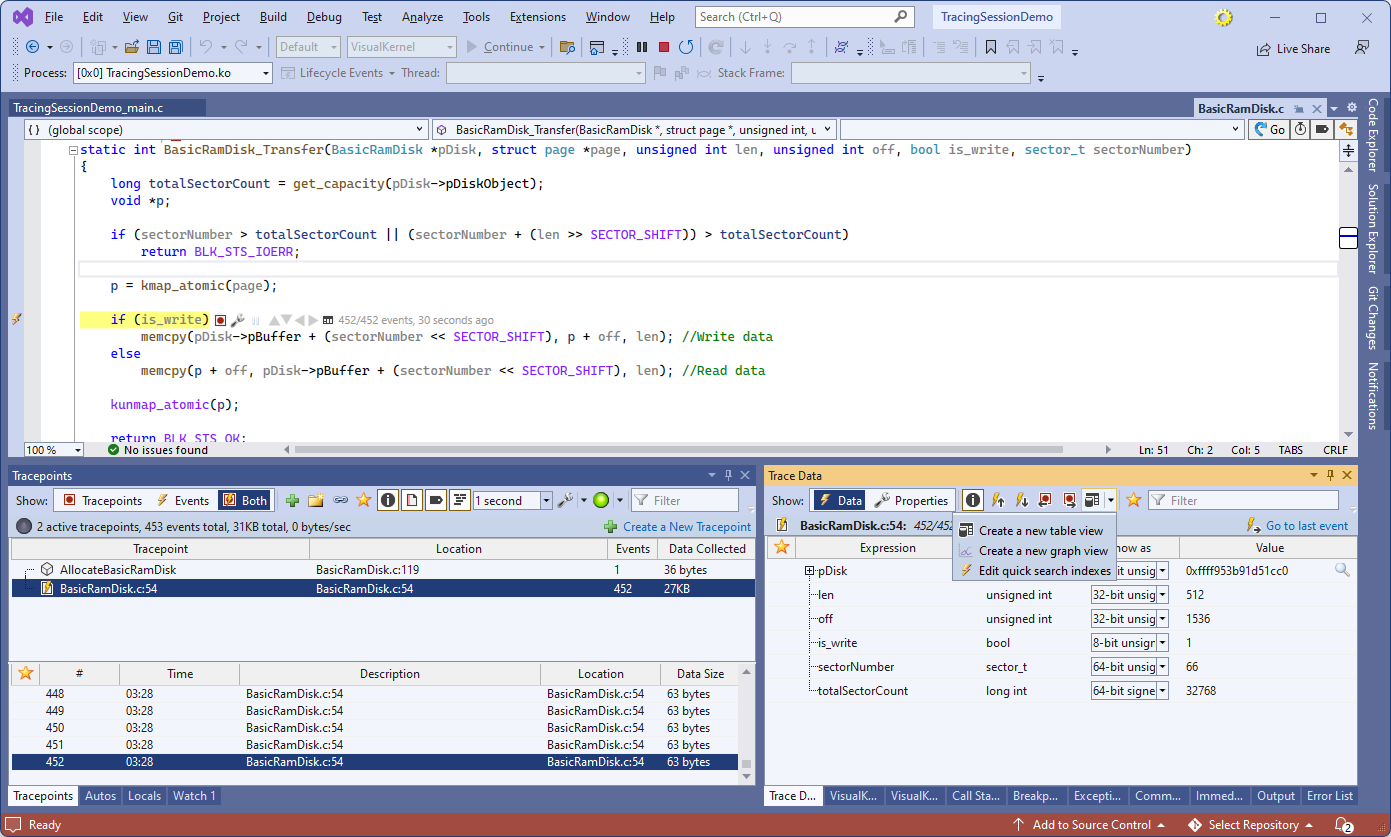
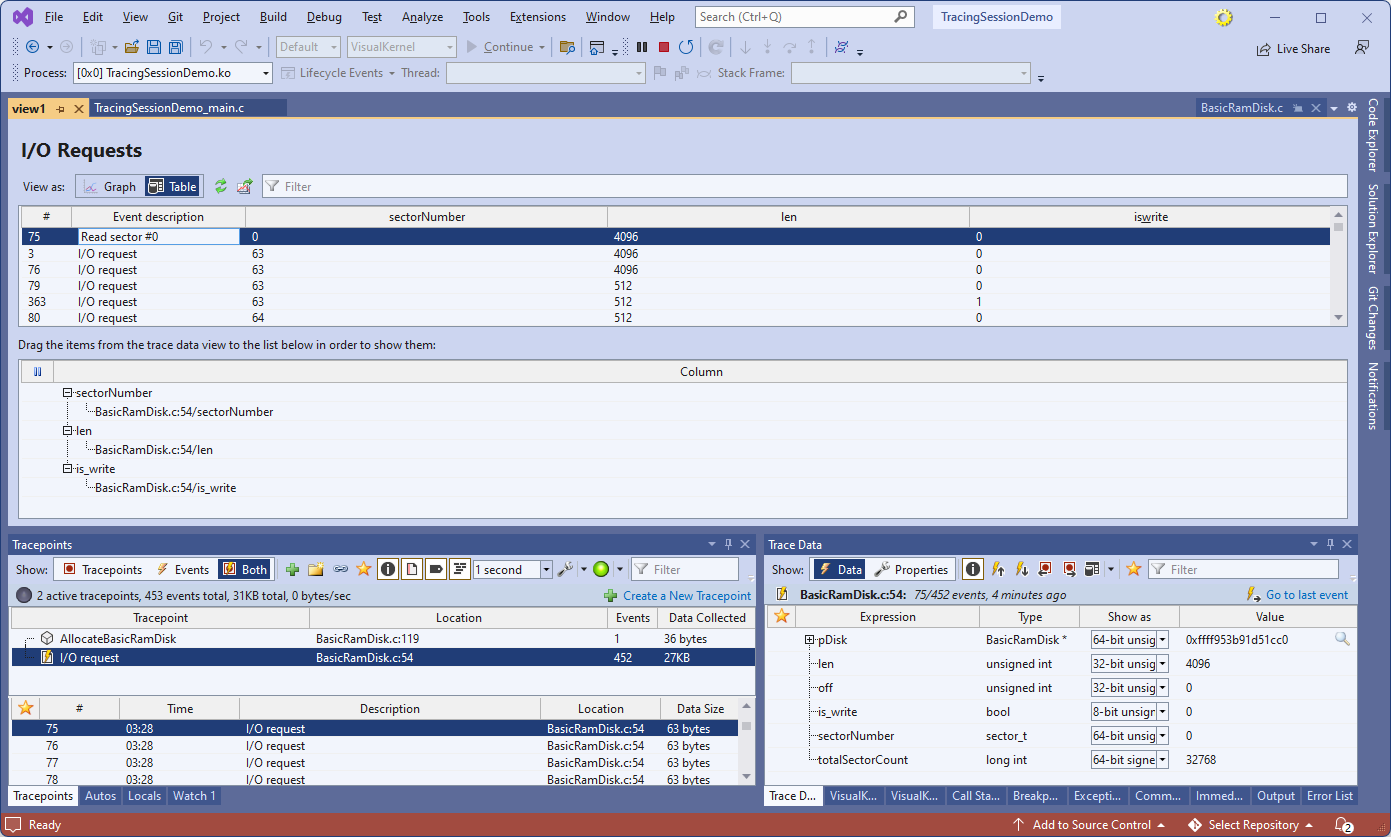
- Navigating multiple events producing loads of data could be challenging. To make it easier, VisualKernel allows creating table and graph views to make better sense of them. Go to the Trace Data window, click the Views button and select “Create a new table view”:
- Drag the sectorNumber, len and is_write variables from the Trace Data window into the bottom part of the view. This will create a 3-column table showing all events that captured these variables:
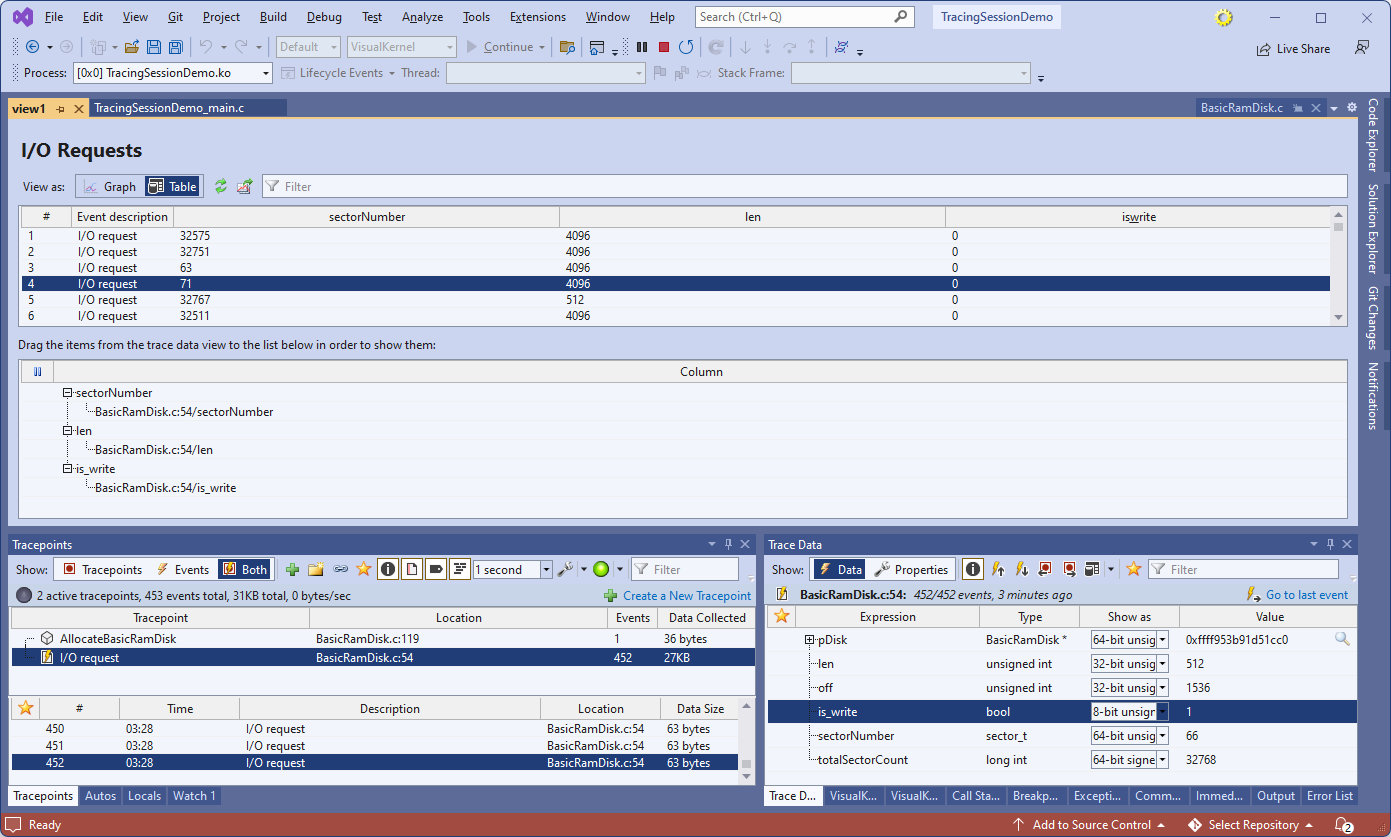 Each column can have multiple variables from different events (e.g. file handle from both read() and write() calls).
 - Click the sectorNumber column to sort the table by sector number. You can then set the custom event description to easily find it later:
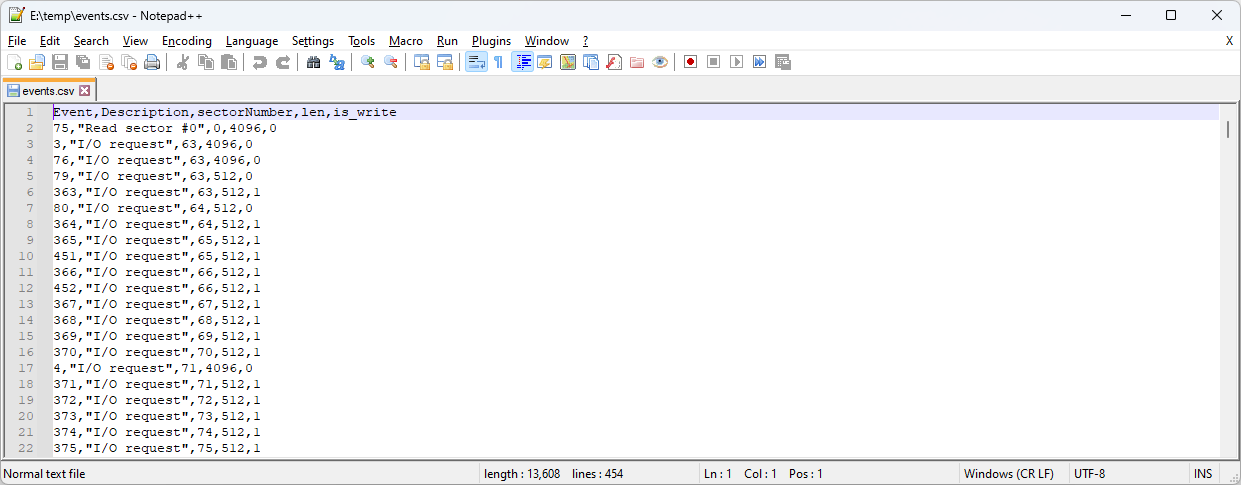
- Click the “Export to CSV” button next to the Graph/Table view switch. VisualKernel will export the event data into a CSV file that can be used to analyze the data further:
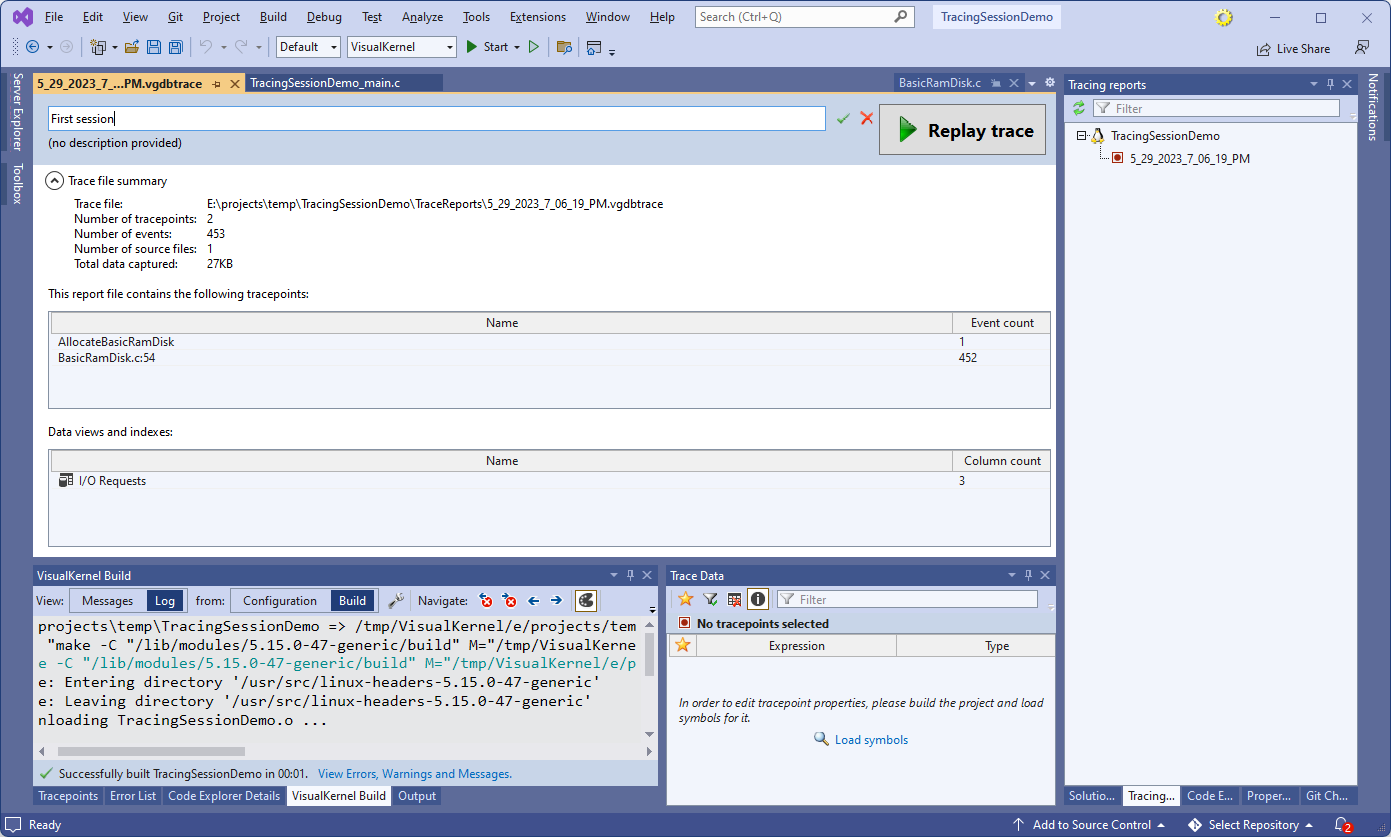
- Once you are done tracing, press Shift-F5 to end debugging session. VisualKernel will save a trace report that can be loaded and replayed later. For convenience, you can rename the reports, or provide additional descriptions to them: