In the last couple of weeks, I was doing some code analysis for a couple of products, some of them were part of my daily job and the other was for research purposes.
During this period, I was trying to do automation for my code analysis process to reduce the amount of work that I do by hand, I already wrote some scripts to help me find potential weaknesses in the code, but I was looking to take this to the next level.
So I start coding Bughound, which is a static code analysis tool based on ElasticSearch and Kibana that aims to help you to map all the weaknesses inside the code and speed up the tracing process.
What is Bughound?
Bughound is an open-source static code analysis tool that analyzes your code and sends the results to Elasticsearch and Kibana instances to get useful insights about the potential vulnerabilities in your code.
Bughound has its own Elasticsearch and Kibana Docker image that is preconfigured with dashboards to give you a strong visualization for the findings.
You can easily pull and run the docker image and start the bughound python client which will analyze the code and then send it to the docker container which will visualize all the potential vulnerabilities for you.
Bughound will search for any keywords “which is the unsafe functions” based on a JSON file contains these functions and the core code will make sure that these functions exist in the code, then it will ship them to the Bughound docker container.
Bughound will map the results found in the code and store them in Elasticsearch which will help you to search manually for any potentially vulnerable code schema based on the unsafe functions found.
Also, Bughound has a preconfigured Kibanna dashboards that will give you insights about the potential vulnerabilities that were found.
Bughound is still on the beta version, and it supports PHP and JAVA only for now, and of course, I will add more languages as soon as we go stable.
Bughound Findings Details
When you start the analysis process, Bughound will give you the following results for each potential vulnerability:
- Project Name.
- Vulnerability Category.
- Vulnerable code snippet.
- Line Number.
- Vulnerable file path.
- Programming language.
Bughound installation
Bughound has two main components, the first one is the python code which will do the analysis for you and then send the results to Elasticsearch.
And the second one is the docker image, which contains Elasticsearch and Kibanna with some preconfigured dashboards.
Bughound python client installation
You can get the latest Bughound version from Github, using the following command:
git clone https://github.com/mhaskar/Bughound
Then you need to install all the requirements using the following command:
pip3 instsall requirements.txt
Bughound docker image installation
Also, you need to have docker installed in order to use Bughound custom docker image, or if you want to use your own Elasticsearch and Kibanna instances, you can skip this step but you will not be able to use the preconfigured dashboards.
Check this article to install docker.
After installing Docker, you need to pull the latest image from the official Bughound dockerhub page using the following command:
docker push bughound/bughound:latest
For now, you can get the latest image using the “latest” tag, but keep your eyes on the dockerhub page for any possible changes.
After pulling the image, you can run it using the following command:
docker run --name bughound -p5601:5601 -p 9200:9200 bughound/bughound
This will create a new container called “Bughound” using the image “bughound/bughound” that we pulled, and we will do some port forwarding for ports 5601,9200 on our localhost so we can reach Elasticsearch and Kibanna from our localhost.
Please note that port 5601 will be used to access Kibanna, and port 9200 is used to reach Elasticsearch itself.
You may need to increase the max virtual memory in order to use the image, so please make sure to run this command:
sysctl -w vm.max_map_count=262144
The container now should be up and running and you can start analyzing the code using the Bughound python core.
Usage
To start the analysis process for your code, you should use the bughound.py script which has some options, to see these options via the help banner, you can use the following command:
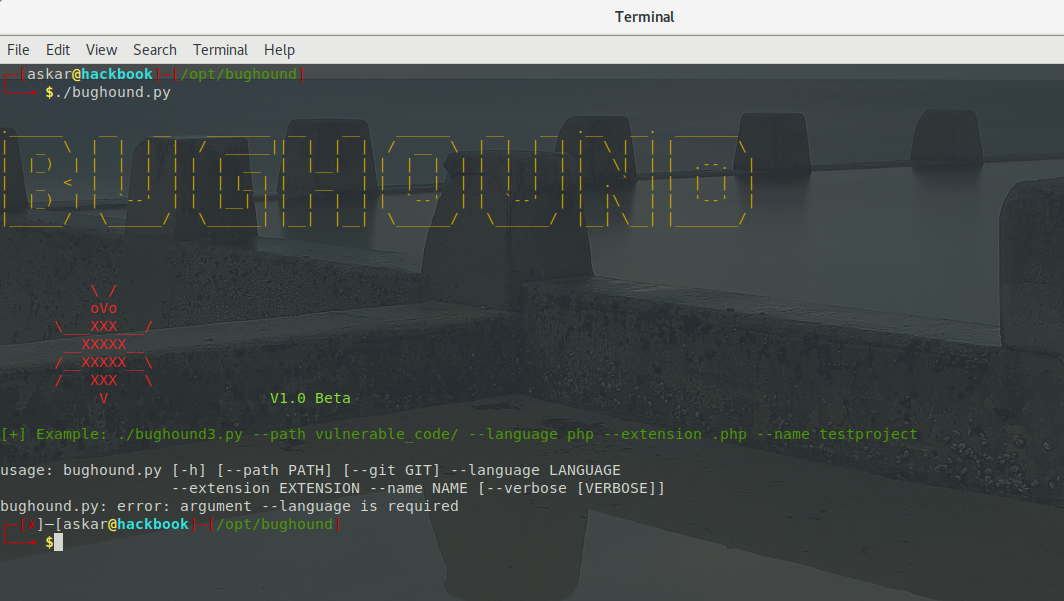
As we can see, there are a couple of options that we can use wich are:
- –path: to scan a project inside a local path.
- –git: to scan a remote git repository.
- –language: choose the programming language you want to scan, currently, you can use “php” and “java” only.
- –extension: the extension of the files inside the project like “.php” or “.java”.
- –name: project name to save inside Elasticsearch.
Local project analysis
You can do a local project analysis using the switch –path as mentioned before like the following:
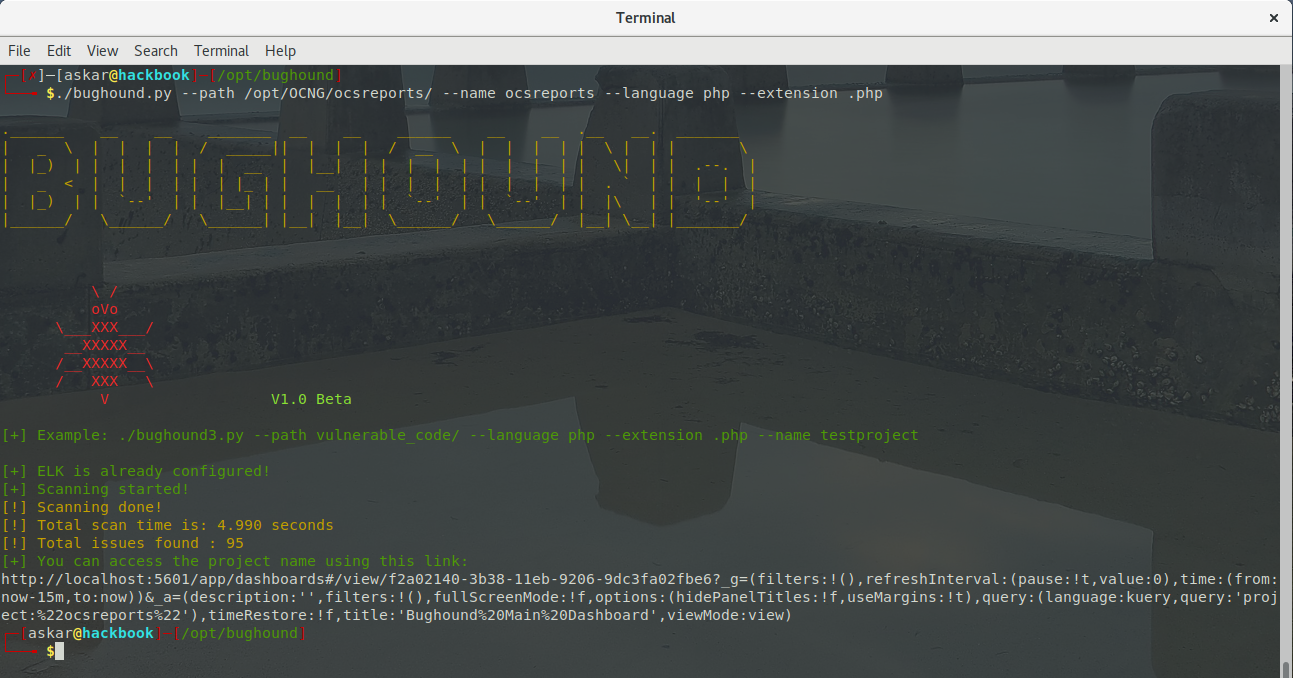
As we can see, the results have been shipped to the docker container and a link was created for you to access the project page.
You can add –verbose to see more details about the shipped results too.
Now let us check Kibanna to check the results:
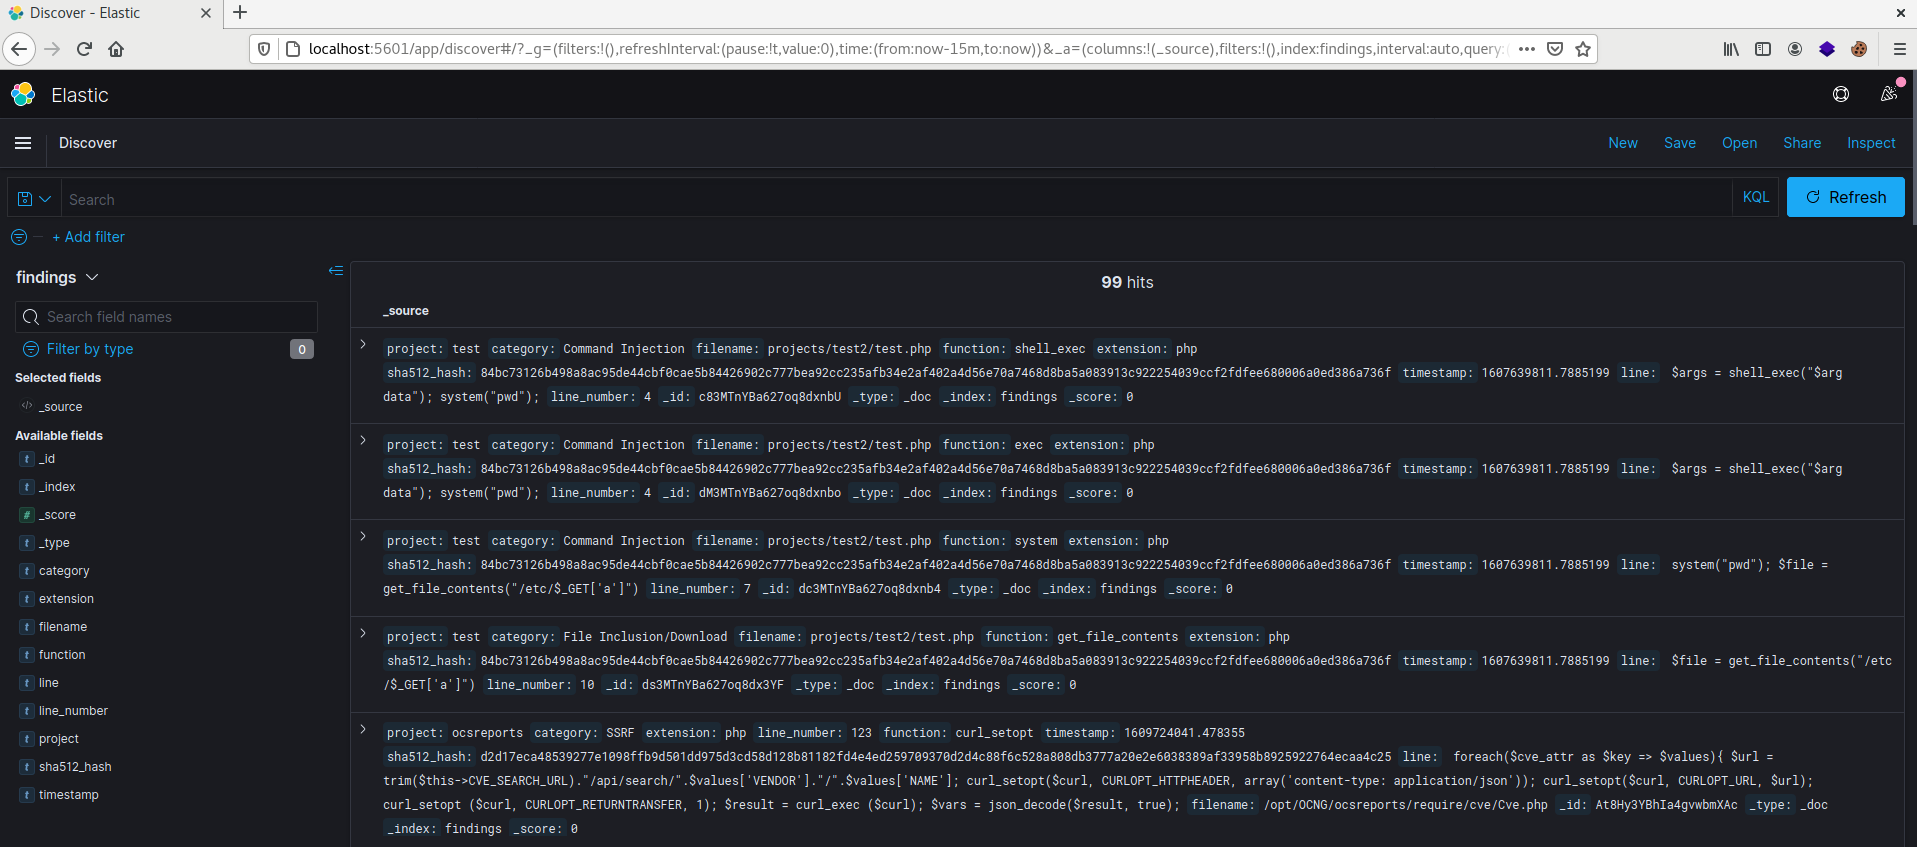
Explore the results
You can explore the raw results using the discover page for Kibanna which from it you will see all the results that were shipped by the bughound python script.
Remote git project analysis
To analyze a git-based project, you can use the “–git” option, this option will clone the remote repository and save it to a new directory called projects, then do a local scan for it.
You can use the following command to analyze a git project:
./bughound.py --git https://github.com/Repo/DummpyProject --name ocsreports --language php --extension .php
Dashboards
Bughound docker image comes with a preconfigured dashboards, these dashboards will give you useful insights about the potential vulnerabilities inside the code and will show you some graphs and table for you.
You can go to dashboards using Kibanna, by going to the following URL:
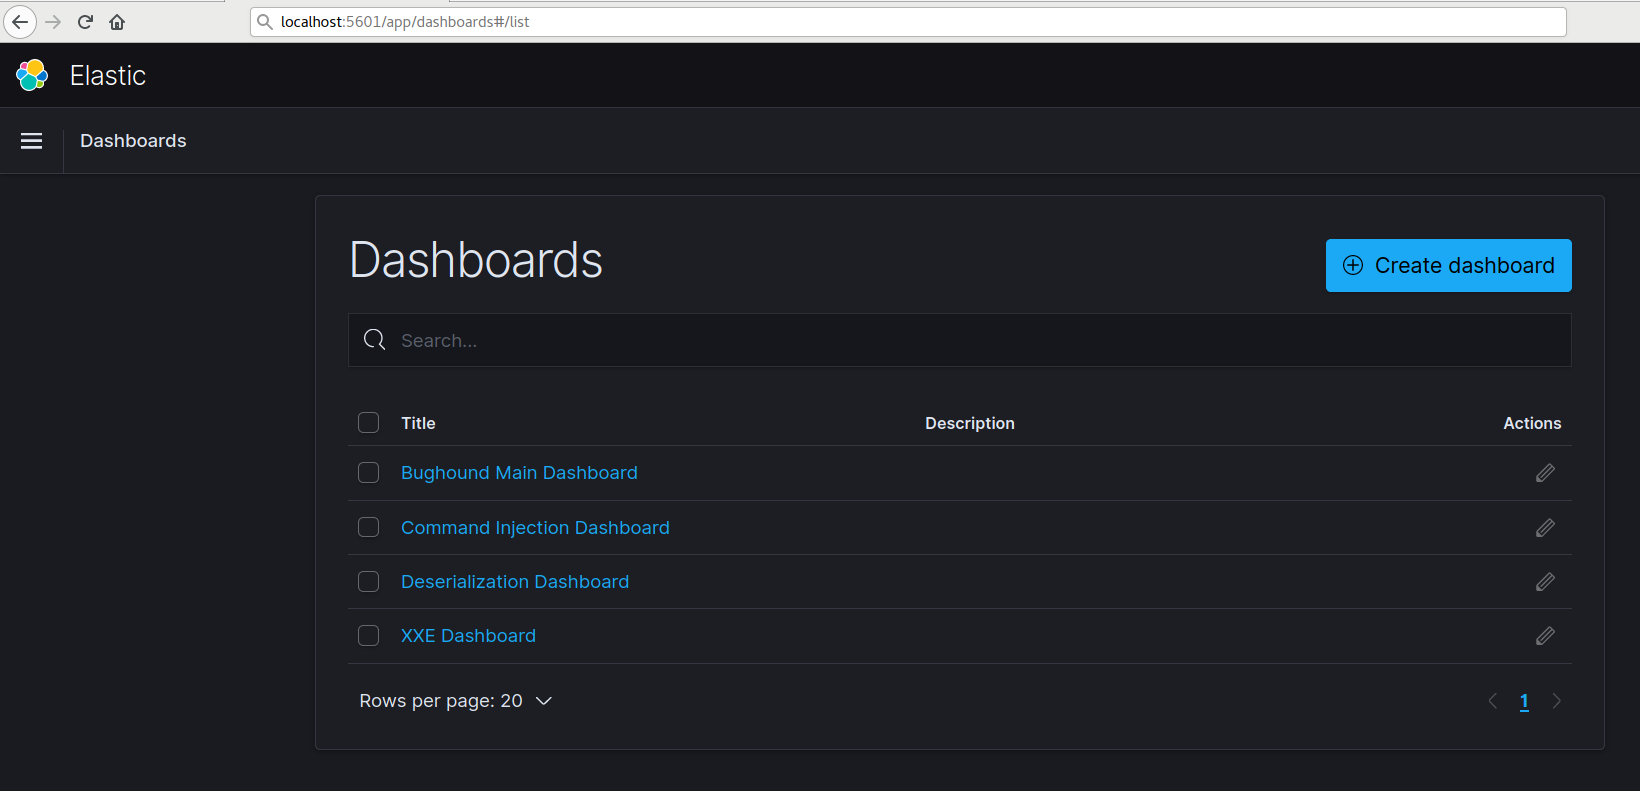
Inside each dashboard, you will find related details to the vulnerability category itself, and inside “Bughound Main Dashboard” you will see general details about the projects that you were analyzing.
And for example, if we checked the “Command Injection” dashboard, we can get the following:
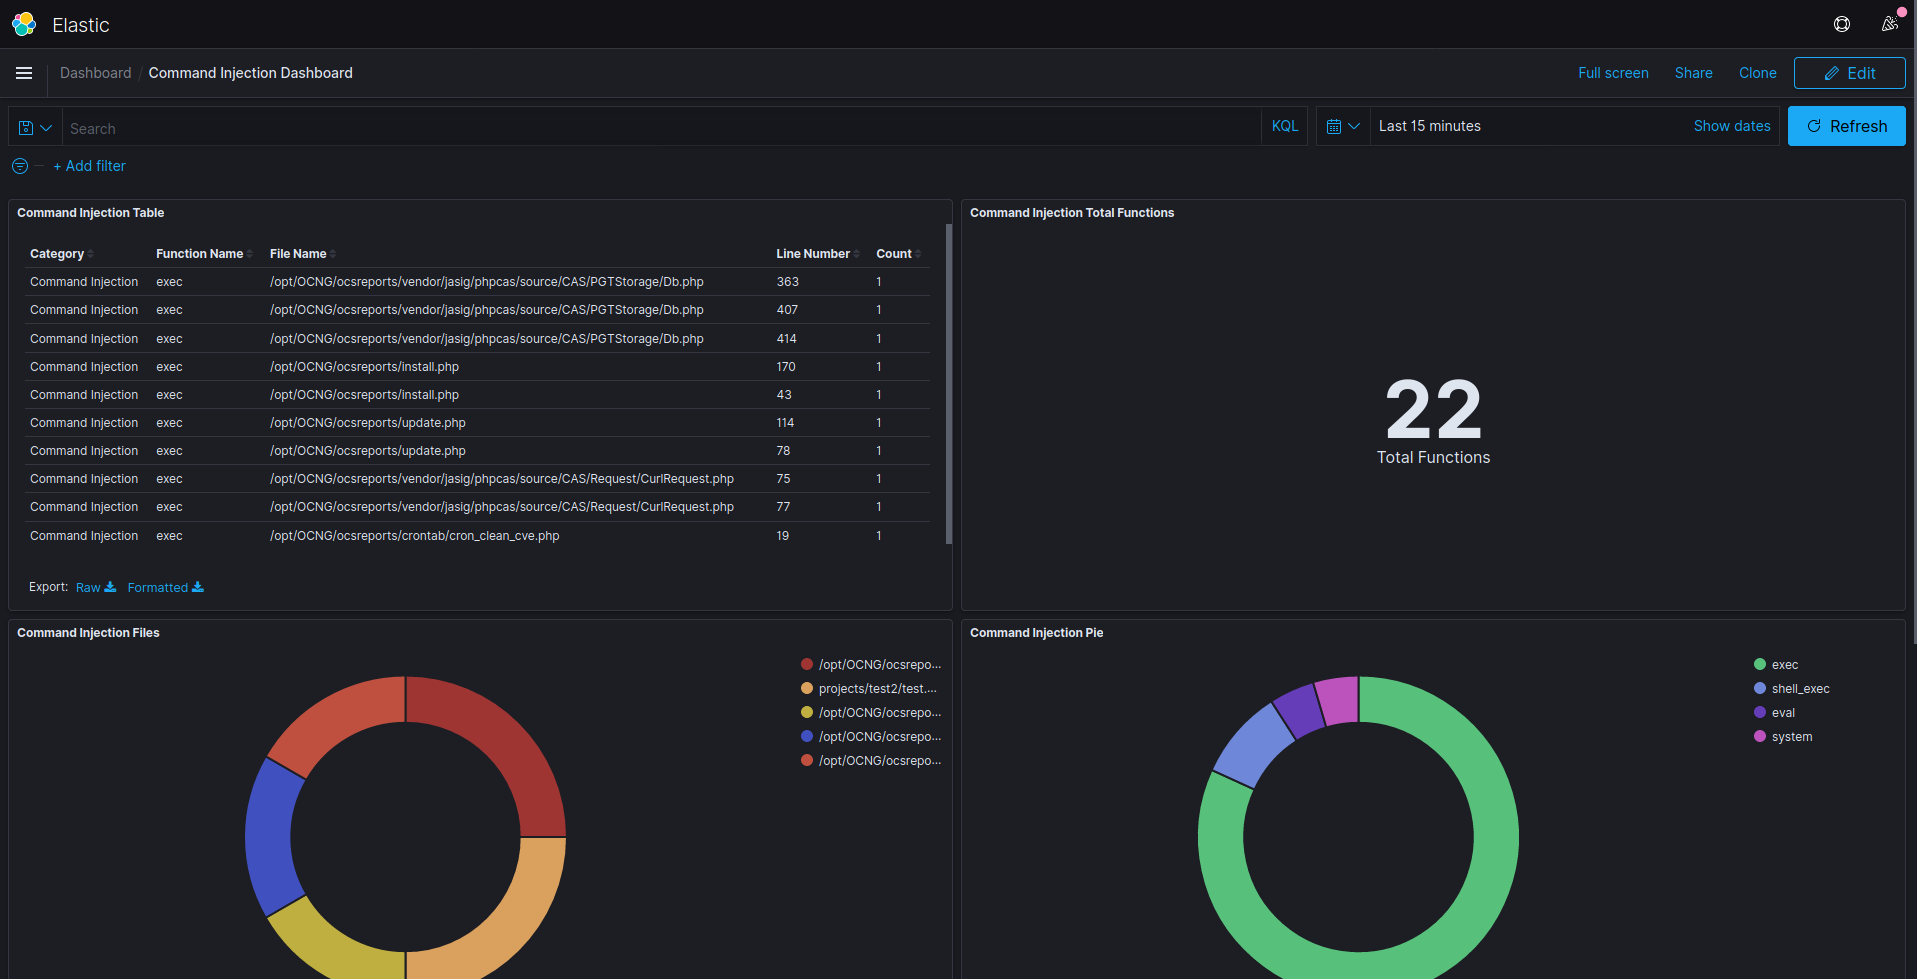
Of course, you can add new dashboards to deal with, but remember that the container is not persistent and you need to commit the container after any changes so you can save it.
Searcing for function
You can write custom queries to find specific data, for example, you can search for a function in a specific file, or with some other keywords inside the code snippet that will show to you under the “line” field which will hold 6 lines of code for each finding.
It will hold 3 lines before the function and 3 lines after it.
For example, we will search for the function “shell_exec” to get all the results inside a project called “ocsreports”:

You can write quires in KQL and Lucene syntax if you want, so feel free to search in any syntax you prefer.
You can scan multiple projects at the same time and all of them will be stored inside the main index called “findings” and you can select the “project” field to filter for a specific project name.
Add/Edit functions to search for
Bughound depends on a JSON file as a database to hold all the details of the vulnerable functions, and as I mentioned before, Bughound only search for PHP and JAVA functions, and for PHP, there is a simple regex included in the JSON file that will be used to extract the vulnerable functions.
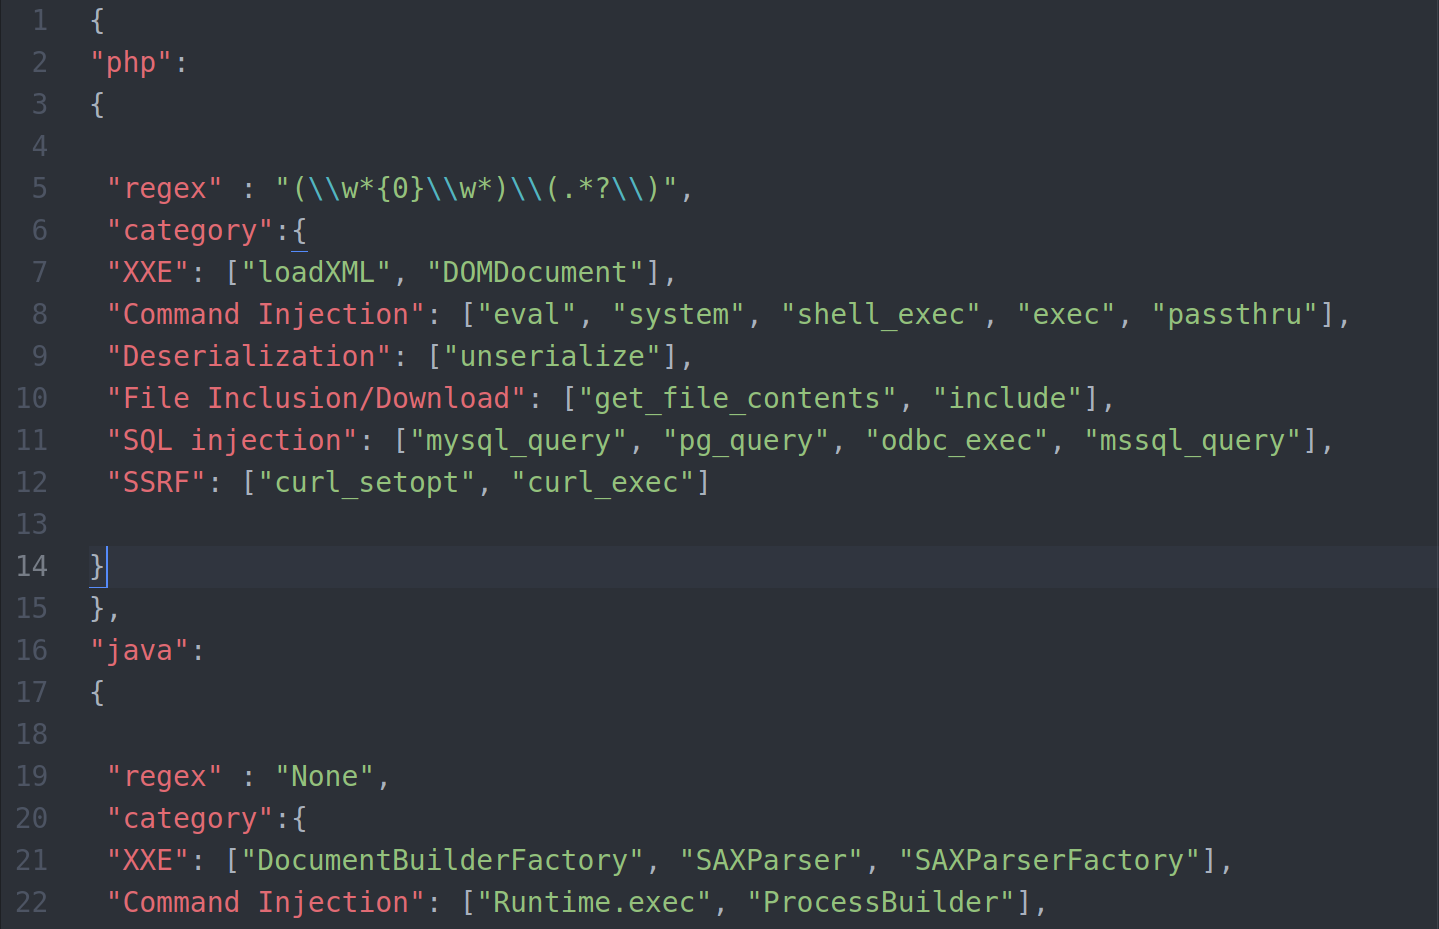
The JSON key always holds the category for the function and then a list of values as vulnerable functions declared which you can add to or remove.
You can add, edit and remove any entries from the file, For example, you can add a new category in PHP by adding the following line:
"MyCategory": ["MyFunction"]
If you are new to JSON, please check this reference for more info.
Please note that these functions are definitely not all the vulnerable functions for a language, but they were picked up as common things to search for and as a PoC of what you can do.
With the next releases we will add more, also, feel free to add any entry using a PR 😉
Contribution
Bughound is still under development, any contributions are welcome as well as any issues that you could discover.
Feel free to open a pull request or an issue on the project Github repository and I will be more than happy to review them once I had a chance to do.
Final Words
Bughound was created to help pentesters/developers to find any “potential” issues inside their code, it will help you to trace the findings in order to find any real vulnerabilities in your code.
You can’t use it as a 100% accurate “code scanner” because it’s not a code scanner, use it only when you want to do some manual code analysis and to save some effort and time searching for a point to start your hunt.
Credits
I want to thank both Ian and Tesla for their help during this project!